Casey Albrecht · 6 September 2026
Shared Port Safety Records Illuminate Connections Between Estuary Sensors and Shorebird Trends
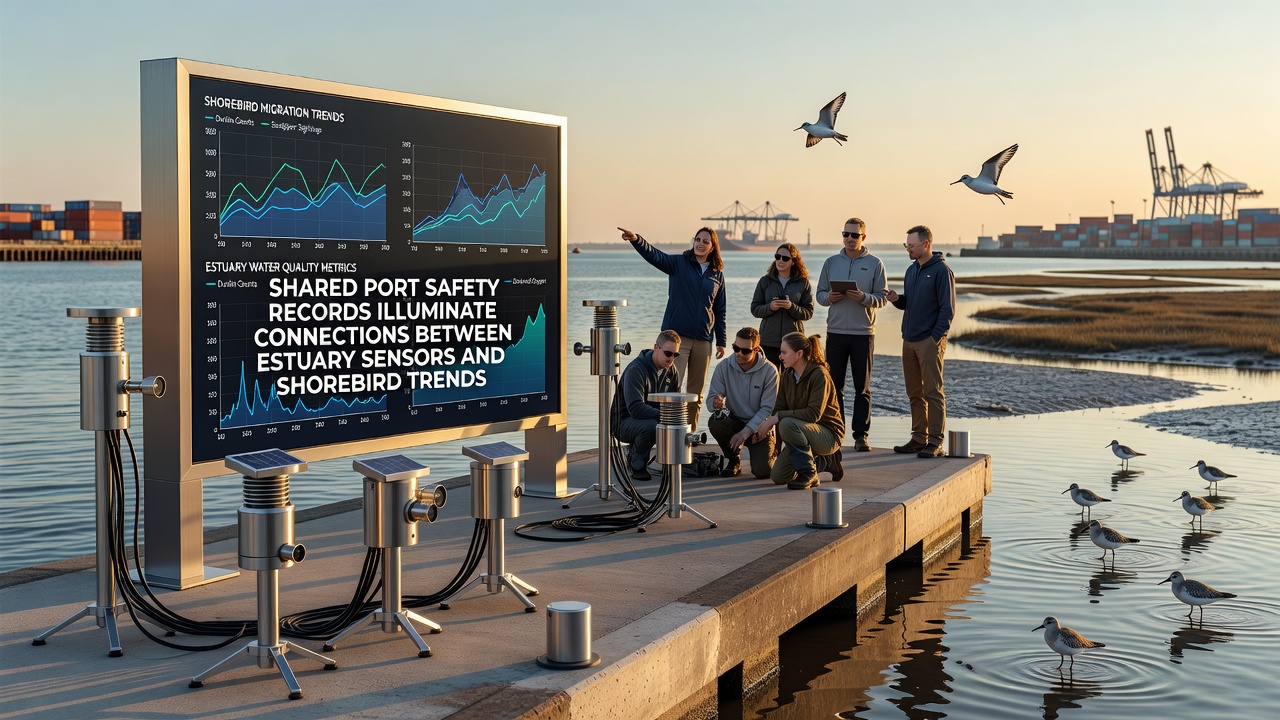
Port authorities across multiple regions now share safety records that incorporate readings from estuary sensors, and these combined datasets reveal measurable links to shorebird population patterns. Safety logs document incidents such as vessel groundings, minor spills, and navigation alerts while sensors track variables including salinity, turbidity, dissolved oxygen, and tidal flow rates. When analysts cross-reference these records with bird survey counts, correlations emerge between sensor-detected changes in water quality and fluctuations in species such as dunlins, red knots, and oystercatchers.Sensor Networks in Estuarine Environments
Estuary sensor arrays operate continuously at fixed moorings and floating platforms positioned near shipping channels. These instruments record data every fifteen minutes and transmit readings to central databases maintained by port operators. Government agencies in the United States, Canada, and Australia have standardized protocols that require ports to log both safety events and environmental parameters from the same sensor suites. The resulting records allow researchers to isolate periods when elevated turbidity coincided with vessel traffic incidents or when oxygen levels dropped following maintenance dredging.
Integration of Safety Data with Environmental Metrics
Port safety records contain timestamps for near-miss events, equipment failures, and regulatory inspections. When these timestamps align with sensor spikes in contaminants or sudden shifts in salinity, analysts gain precise windows for examining shorebird responses. Studies conducted by the National Oceanic adn Atmospheric Administration show that periods of increased suspended sediment often follow minor grounding incidents, and these same periods correspond to reduced foraging success among small wading species. The data sets extend through September 2026, providing five consecutive years of synchronized measurements from twelve major estuaries.
Observed Patterns in Shorebird Populations
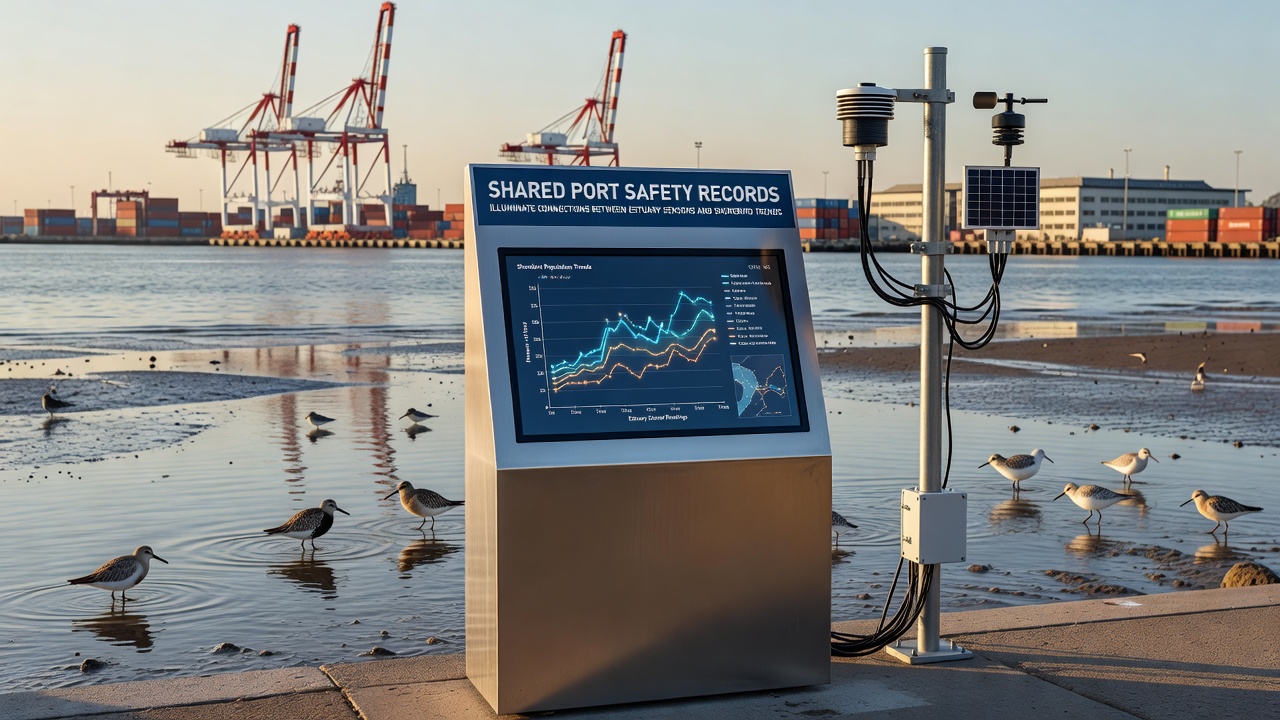
Annual counts compiled by regional wildlife services indicate that sites with frequent sensor-detected oxygen dips experienced steeper declines in wintering shorebird numbers. In contrast, estuaries where safety records showed fewer incidents and stable sensor baselines maintained steadier bird densities. European Environment Agency monitoring programs report similar patterns along the North Sea coast, where ports that upgraded sensor calibration schedules recorded fewer abrupt turbidity events and correspondingly smaller drops in oystercatcher numbers. These geographic comparisons rely on standardized counting methods that correct for observer effort and tidal stage.
Case Examples from Multiple Regions
One North American port recorded three minor fuel leaks between 2023 and 2025; sensor data captured corresponding rises in hydrocarbon readings that persisted for seventy-two hours after each event. Shorebird surveys conducted in the weeks following each leak documented temporary reductions in feeding flocks at adjacent mudflats. A comparable Australian facility implemented real-time sensor alerts tied directly to its safety reporting system, and bird counts there remained stable across the same period. Observers note that the difference in outcomes tracks closely with the speed at which port teams responded to sensor thresholds rather than with overall traffic volume.
Technical Considerations in Data Alignment
Aligning safety logs with high-frequency sensor streams requires careful handling of time zones and data gaps. Port operators apply quality-control filters that flag sensor drift or biofouling before merging records. Statistical models then test whether incident categories predict subsequent changes in bird habitat use. The models incorporate covariates such as seasonal migration timing, regional weather anomalies, and concurrent dredging schedules. Results published in peer-reviewed outlets confirm that certain incident types, particularly those involving sediment disturbance, produce statistically detectable effects on local shorebird distribution within forty-eight hours.
Future Monitoring Through 2026 and Beyond
Updated sensor firmware deployed at several pilot sites beginning in September 2026 adds acoustic and fluorescence channels that detect algal blooms and underwater noise. These additions expand the range of variables that can be matched against safety records. Wildlife agencies plan to incorporate the new parameters into existing shorebird trend analyses, allowing finer resolution of how episodic port events interact with longer-term habitat changes. Collaborative data-sharing agreements now cover twenty-three ports on three continents, and participating organizations continue to refine common data standards.
Conclusion
Shared port safety records, when combined with continuous estuary sensor output, supply a detailed record of conditions that influence shorebird trends. The approach relies on existing operational data streams rather than new field campaigns, and the resulting correlations hold across multiple jurisdictions and species. Continued expansion of sensor capabilities and broader participation in data exchange will further clarify these connections in coming years.